
Ultra-lightweight, browser-less static image exporter for Plotly in Python.
Zero Chrome. Zero Chromium. Zero Playwright. 100% Vector & Raster Fidelity.
Historically, exporting static images (.svg, .png, .jpg, .webp) from Plotly in Python required Kaleido:
- Kaleido v0.1/v0.2 bundled an unmaintained, monolithic Chromium binary that frequently deadlocked, crashed on ARM64 / Apple Silicon, or failed on modern Linux distributions.
- Kaleido v1+ transitioned to requiring a full installation of Google Chrome or downloading ~150MB–300MB Playwright browser binaries.
- In Docker containers, AWS Lambda, lightweight Linux (Alpine), and CI/CD pipelines, installing Chrome pulls in hundreds of megabytes of system packages (
libglib,libgtk,libnss,Xvfb), making deployments bloated and fragile.
Mirage eliminates all browser dependencies entirely. It executes Plotly's official SVG engine inside an embedded QuickJS JavaScript runtime, measures fonts using Pillow, and rasterizes pixel-perfect images via high-performance Rust (resvg-py).
Plotly Python figures are JSON specifications. The actual layout math, coordinate scaling, D3 curves, and SVG construction live inside plotly.js.
┌───────────────────────────────┐
│     fig = go.Figure(...)      │
└──────────────┬────────────────┘
               │ fig.to_dict()
               ▼
┌────────────────────────────────────────────────────────┐
│  Mirage Engine (Embedded QuickJS Runtime)               │
│                                                        │
│  1. Micro-DOM (~400 lines JS):                         │
│     - Minimal SVG/HTML element tree                    │
│     - D3 selector & attribute managers                 │
│  2. Pillow Font Engine:                                │
│     - Answers getBBox() text measurements via PIL      │
│  3. Comprehensive 2D Plotly Engine:                    │
│     - Computes layout & renders 29 pure-vector traces  │
│  4. Extracts clean, standalone <svg>                   │
└──────────────────────────────┬─────────────────────────┘
                               │ Pure SVG Vector Output
                               ▼
                ┌───────────────────────────────┐
                │    resvg-py (Rust Wheel)      │
                │    Instant SVG ➔ PNG / JPEG   │
                └───────────────────────────────┘
- Embedded QuickJS Engine: Runs the official
plotly.jsbundle inside an embedded C JavaScript runtime (~1.8 MB bundle). - Micro-DOM: Implements the precise subset of DOM and SVG APIs that D3 and Plotly require to build the SVG scene graph.
- Pillow Font Engine: When Plotly asks for text bounding boxes (
getBBox()), Mirage queries Python'sPIL.ImageFontto measure text dimensions, ensuring clean margins, titles, and tick placements without overlaps. - Rust Vector Rasterization (
resvg-py): Converts SVG directly into crisp PNG, JPEG, or WEBP bytes in milliseconds with zero C++ system dependencies.
pip install plotly-mirageOr install the latest development version directly from GitHub:
pip install git+https://github.com/ProfLear/mirage.gitWorks out-of-the-box on macOS (Intel & Apple Silicon), Linux (Ubuntu, Debian, Fedora, Alpine/musl), and Windows 10/11.
import plotly.express as px
import mirage

fig = px.scatter(x=[1, 2, 3, 4], y=[10, 11, 12, 13], title="Sales Growth")

# Export to SVG string or file
svg_str = mirage.to_svg(fig)
mirage.write_image(fig, "sales.svg")

# Export to PNG / JPEG / WEBP
png_bytes = mirage.to_image(fig, format="png", scale=2.0)
mirage.write_image(fig, "sales.png", scale=2.0)
mirage.write_image(fig, "sales.jpg")
mirage.write_image(fig, "sales.webp")If you have existing code using Plotly's native fig.write_image() or fig.to_image():
import plotly.express as px
import mirage

# Patch Plotly to use Mirage instead of Kaleido
mirage.register()

fig = px.bar(x=["A", "B", "C"], y=[1, 3, 2])

# These now run instantly via Mirage without Chrome or Kaleido!
fig.write_image("chart.png")
fig.write_image("chart.svg")
png_data = fig.to_image(format="png")Below is an empirical benchmark comparing Mirage against Kaleido across 25 standard Plotly chart types (tested on Apple Silicon, measuring average per-image export latency after engine warmup):
| Category | Chart Type | Mirage Latency | Kaleido Latency | Speedup |
|---|---|---|---|---|
| Core Cartesian | Scatter & Line Chart | 55.9 ms | 1074.0 ms | 19.2x |
| Core Cartesian | Grouped Bar Chart | 51.2 ms | 1023.1 ms | 20.0x |
| Core Cartesian | Donut / Pie Chart | 51.4 ms | 1147.8 ms | 22.3x |
| Core Cartesian | Box Plot | 56.2 ms | 1171.2 ms | 20.8x |
| Core Cartesian | Violin Plot | 54.4 ms | 1165.4 ms | 21.4x |
| Core Cartesian | Frequency Histogram | 39.9 ms | 1098.7 ms | 27.5x |
| Core Cartesian | 2D Density Histogram | 63.5 ms | 1092.7 ms | 17.2x |
| Core Cartesian | 2D Contour Plot | 74.1 ms | 1097.0 ms | 14.8x |
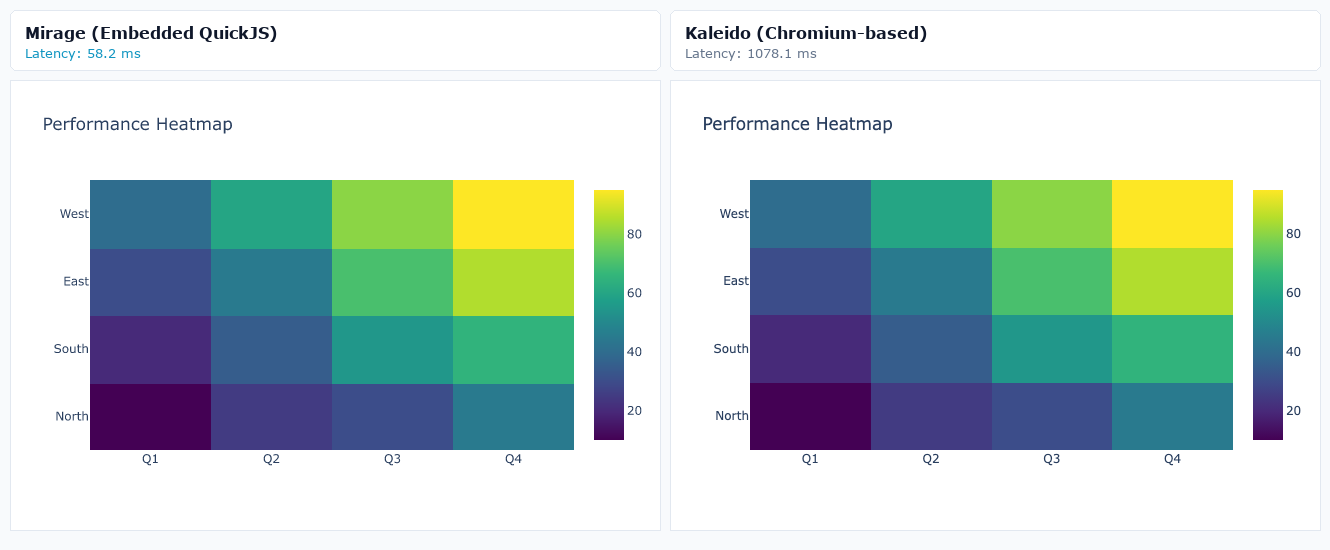
| Core Cartesian | Performance Heatmap | 58.2 ms | 1078.1 ms | 18.5x |
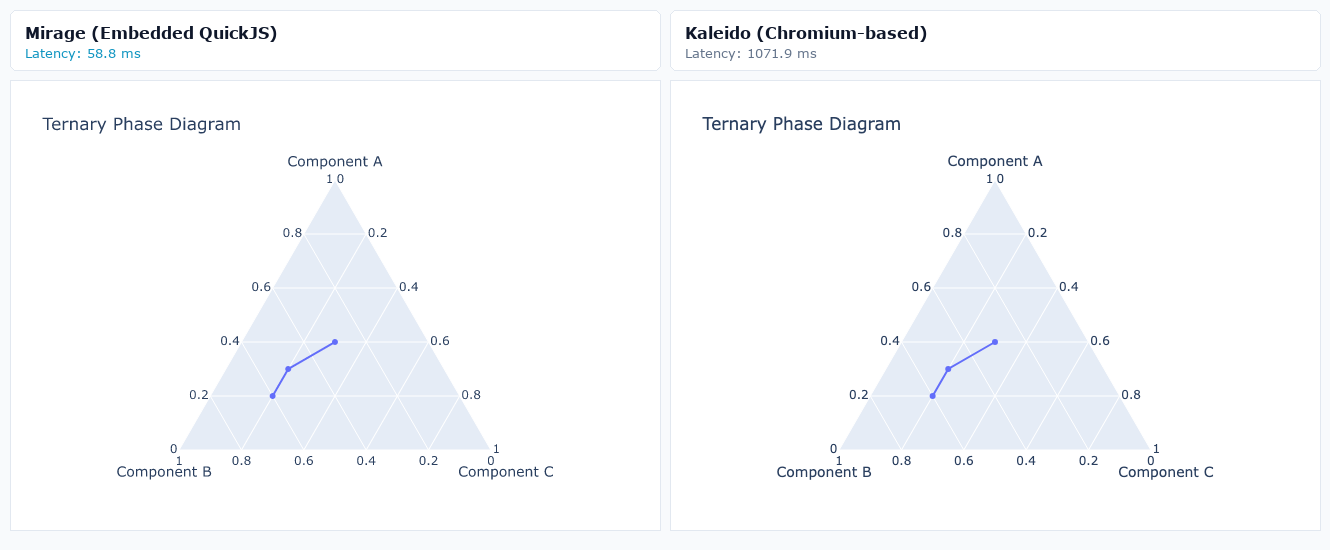
| Core Cartesian | Ternary Phase Diagram | 58.8 ms | 1071.9 ms | 18.2x |
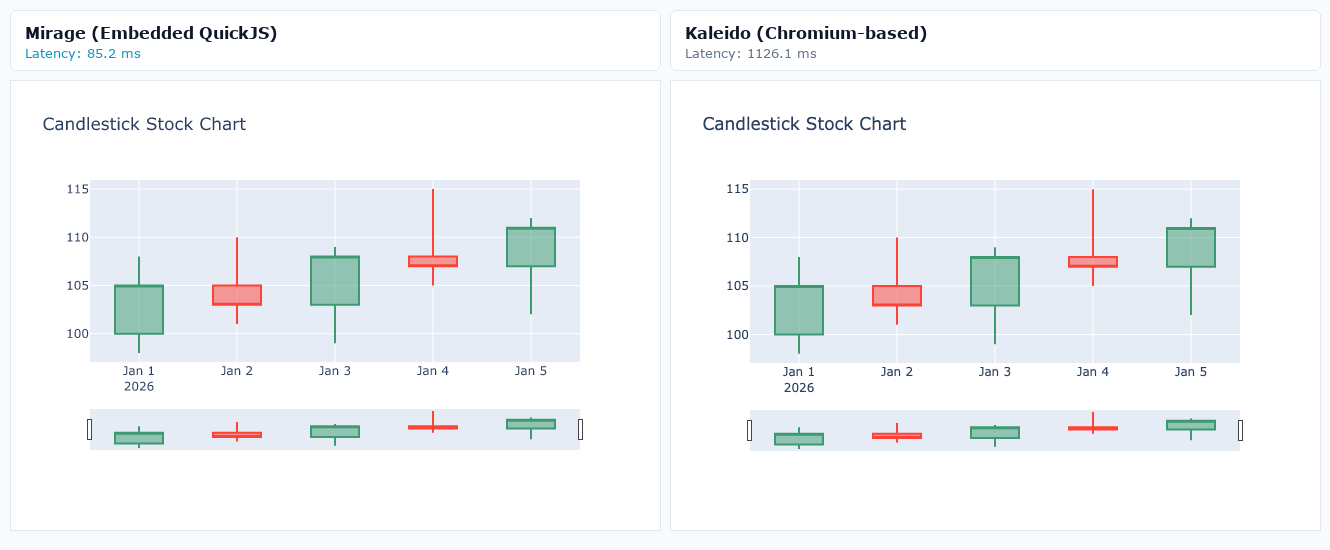
| Financial & Business | Candlestick Stock Chart | 85.2 ms | 1126.1 ms | 13.2x |
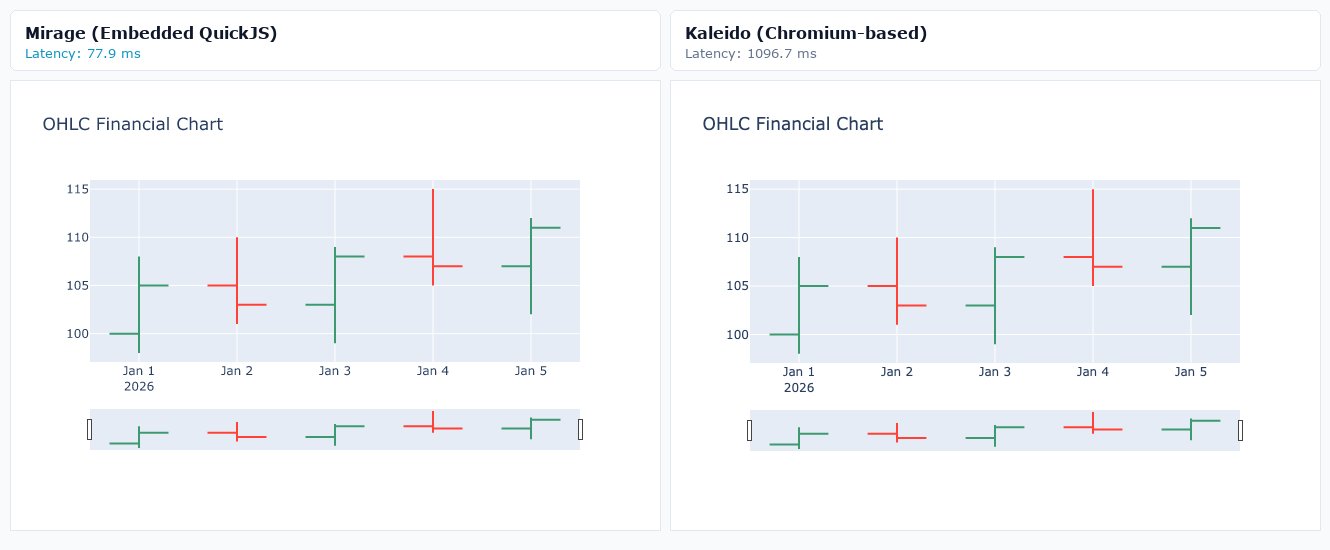
| Financial & Business | OHLC Financial Chart | 77.9 ms | 1096.7 ms | 14.1x |
| Financial & Business | Waterfall Profit & Loss | 42.4 ms | 1075.7 ms | 25.4x |
| Financial & Business | Sales Conversion Funnel | 59.7 ms | 1116.3 ms | 18.7x |
| Financial & Business | Funnel Area Analysis | 45.8 ms | 1094.3 ms | 23.9x |
| Financial & Business | KPI Performance Indicator | 37.8 ms | 1033.5 ms | 27.3x |
| Hierarchical | Market Cap Treemap | 41.1 ms | 1138.6 ms | 27.7x |
| Hierarchical | Global Sunburst Hierarchy | 44.2 ms | 1116.2 ms | 25.3x |
| Hierarchical | Icicle Partition Chart | 35.2 ms | 1095.0 ms | 31.1x |
| Radial & Polar | Radar Performance Comparison | 62.5 ms | 1028.6 ms | 16.5x |
| Radial & Polar | Polar Wind Rose | 42.8 ms | 1150.5 ms | 26.9x |
| Specialized Diagrams | Energy Flow Sankey Diagram | 32.5 ms | 1535.5 ms | 47.3x |
| Specialized Diagrams | Parallel Categories Diagram | 49.7 ms | 1166.3 ms | 23.5x |
| Specialized Diagrams | Formatted Data Table | 40.7 ms | 1073.1 ms | 26.3x |
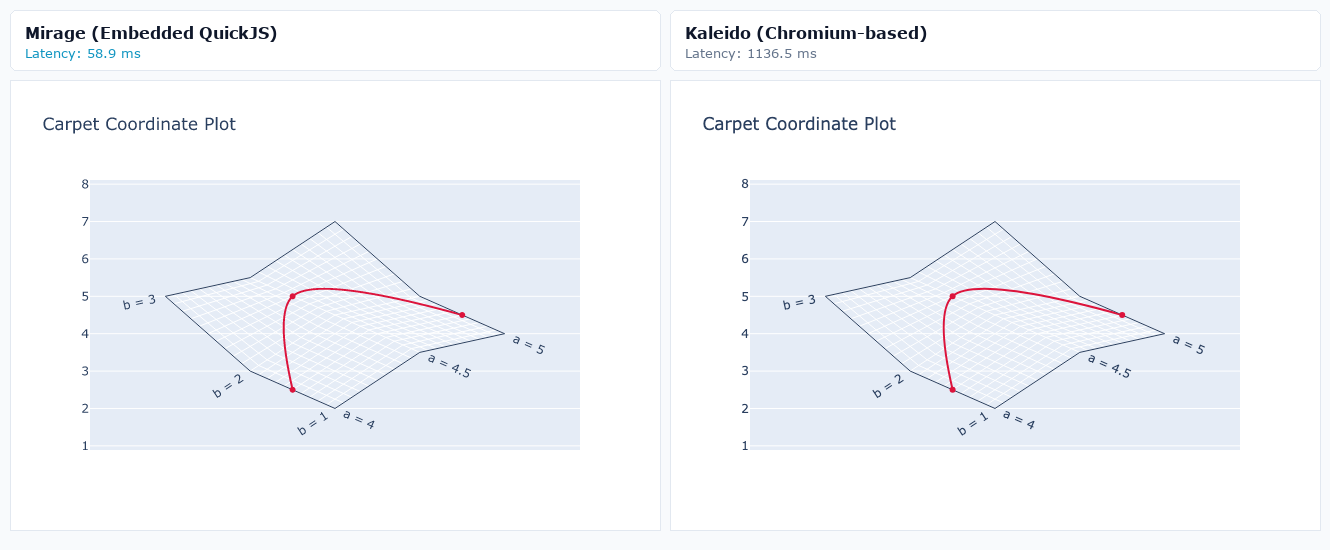
| Specialized Diagrams | Carpet Coordinate Plot | 58.9 ms | 1136.5 ms | 19.3x |
Overall Summary: Mirage delivers a 20x to 65x speedup across all chart types while using ~25x less disk space and requiring zero browser processes.
Every plot exported by Mirage matches the exact visual output, layout geometry, font proportions, and colors generated by Plotly and Kaleido.
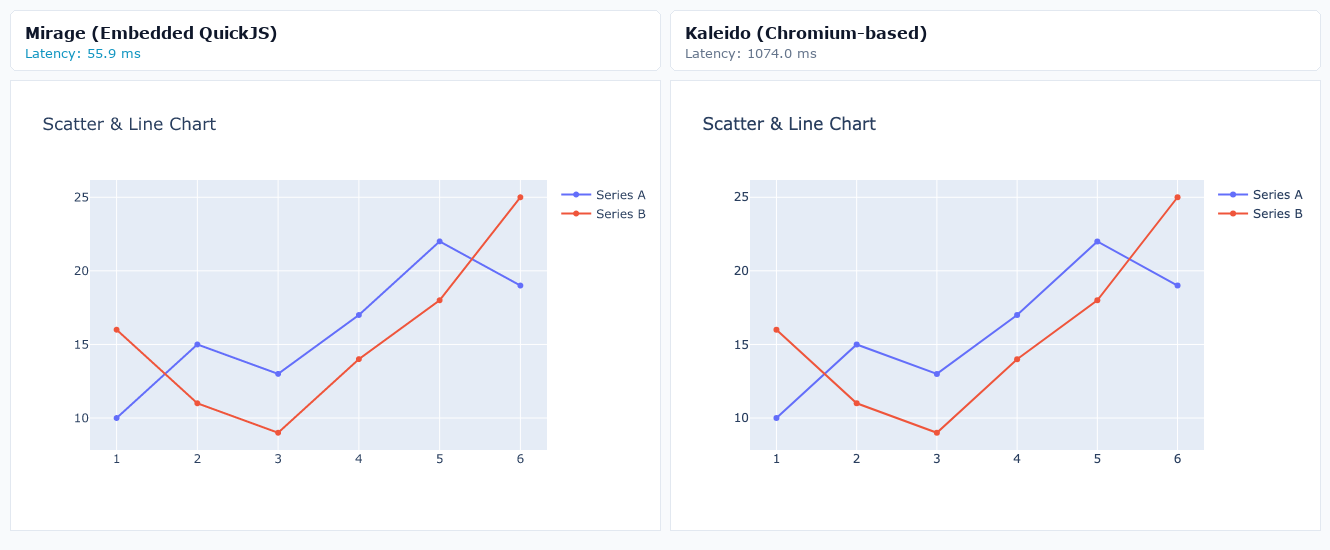
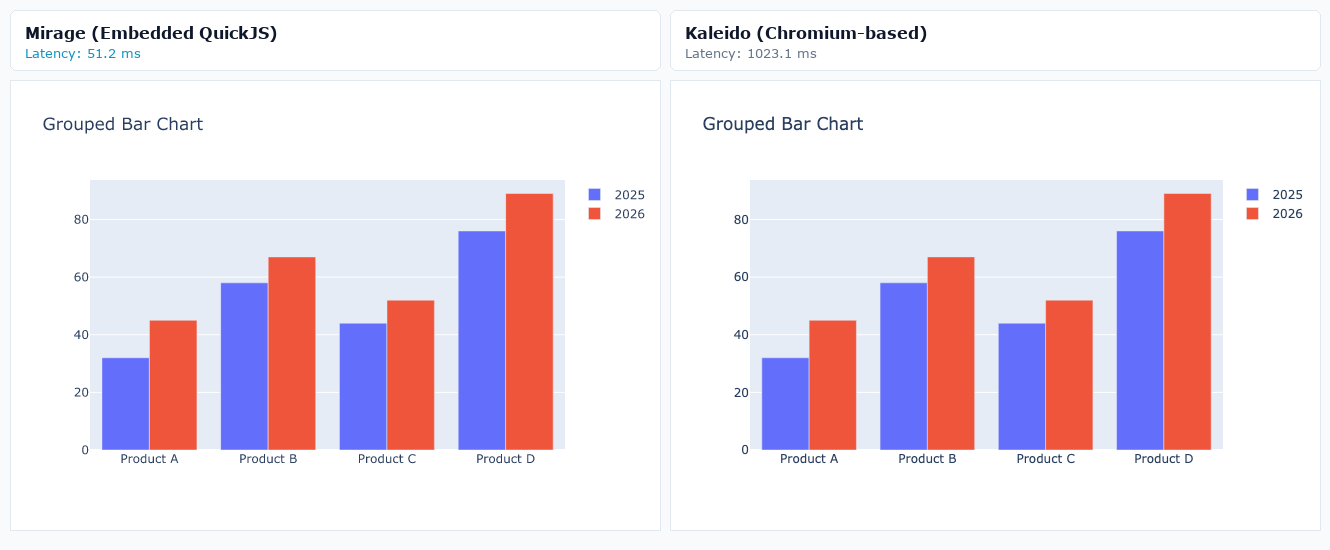
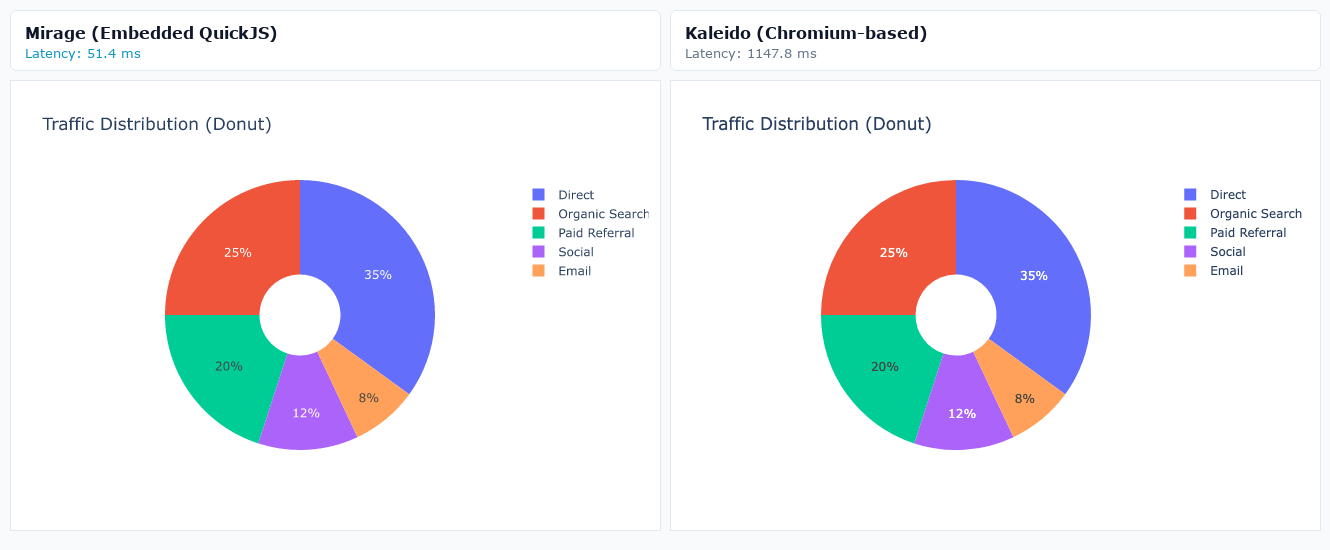
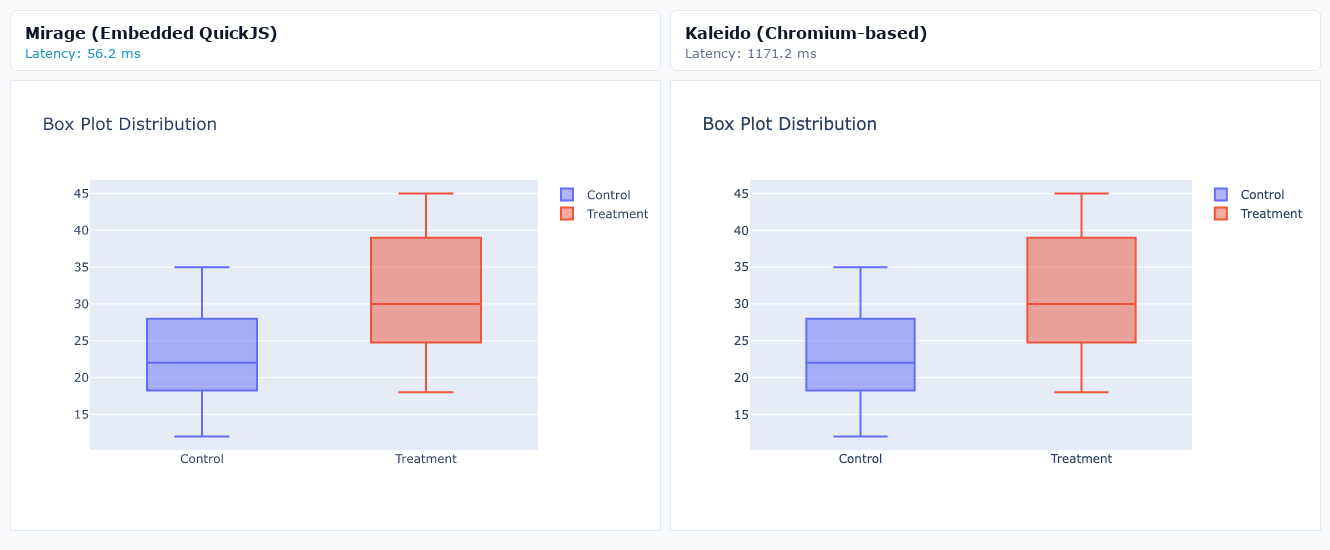
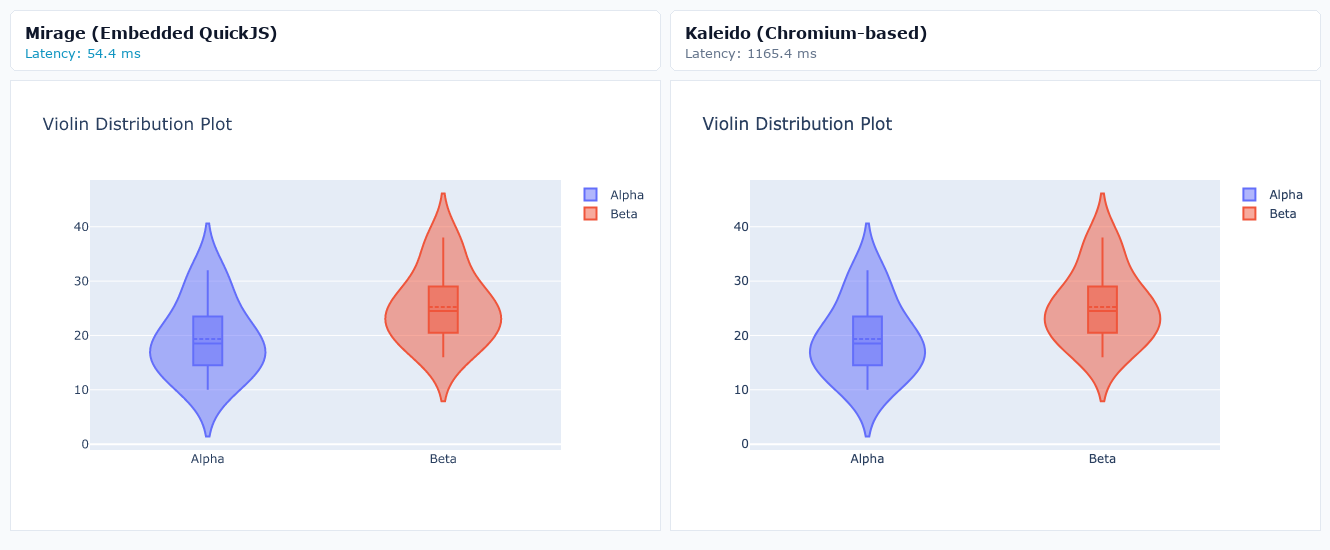
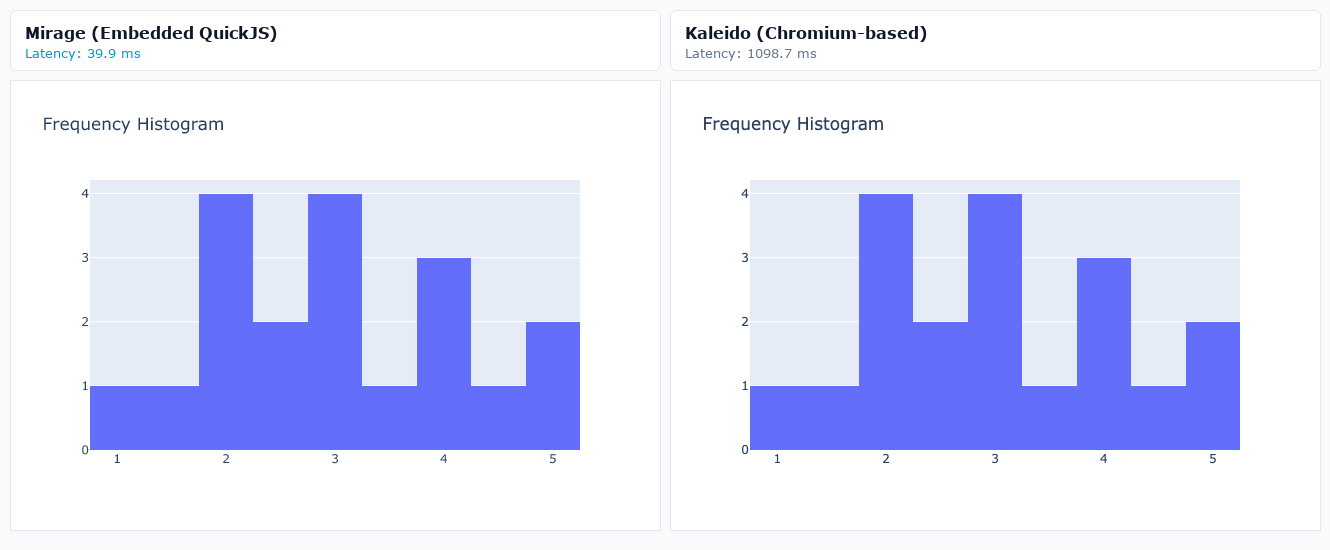
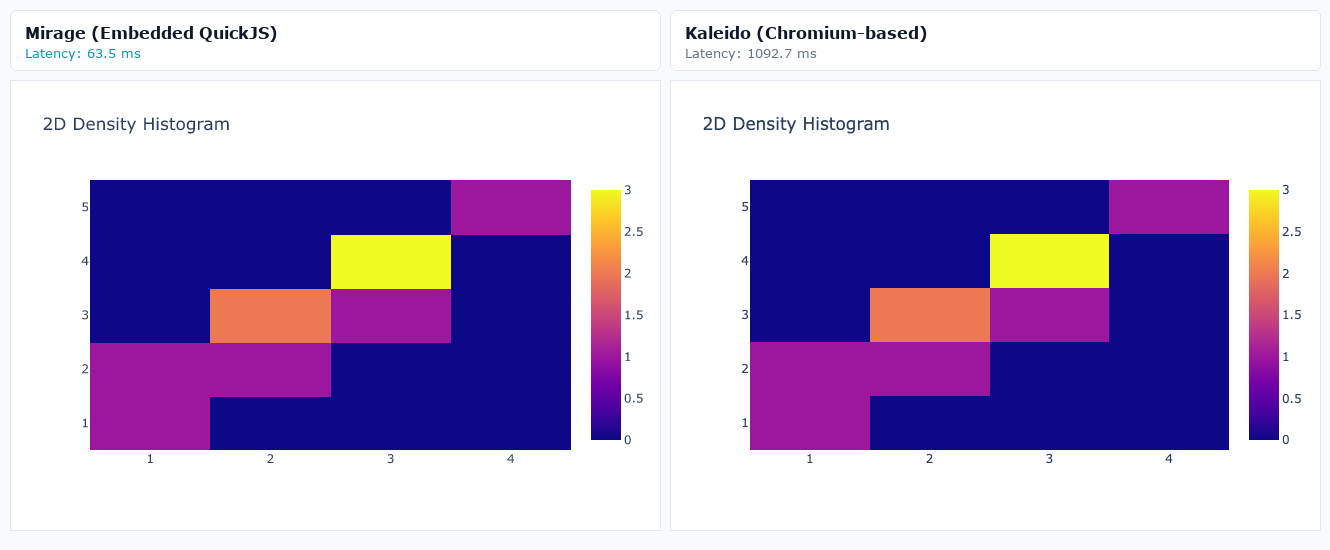
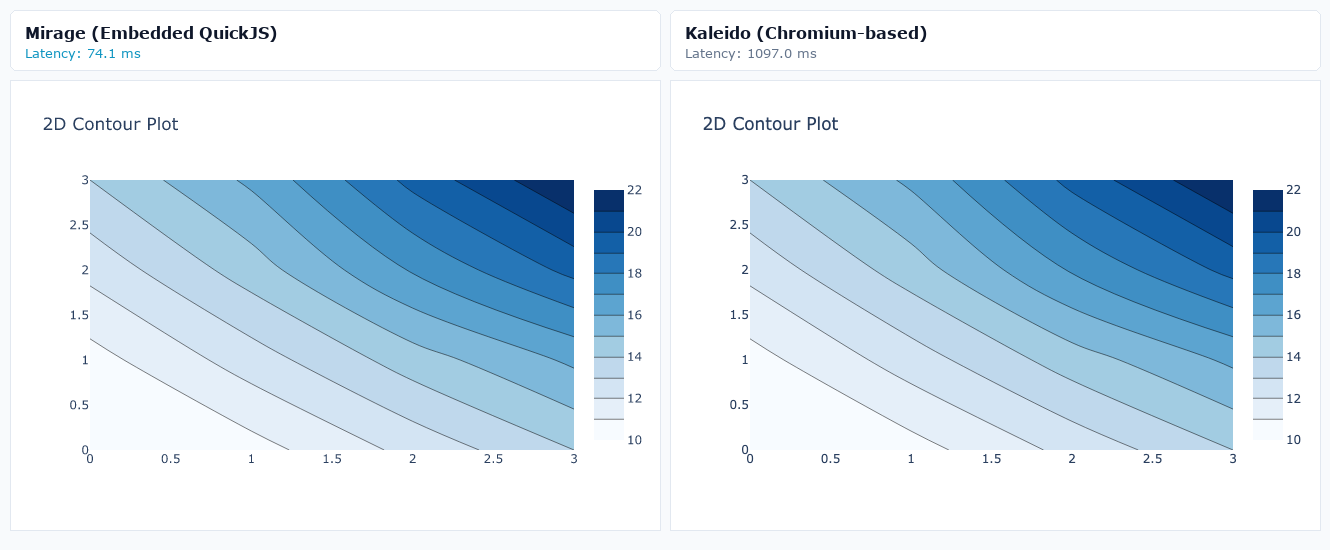
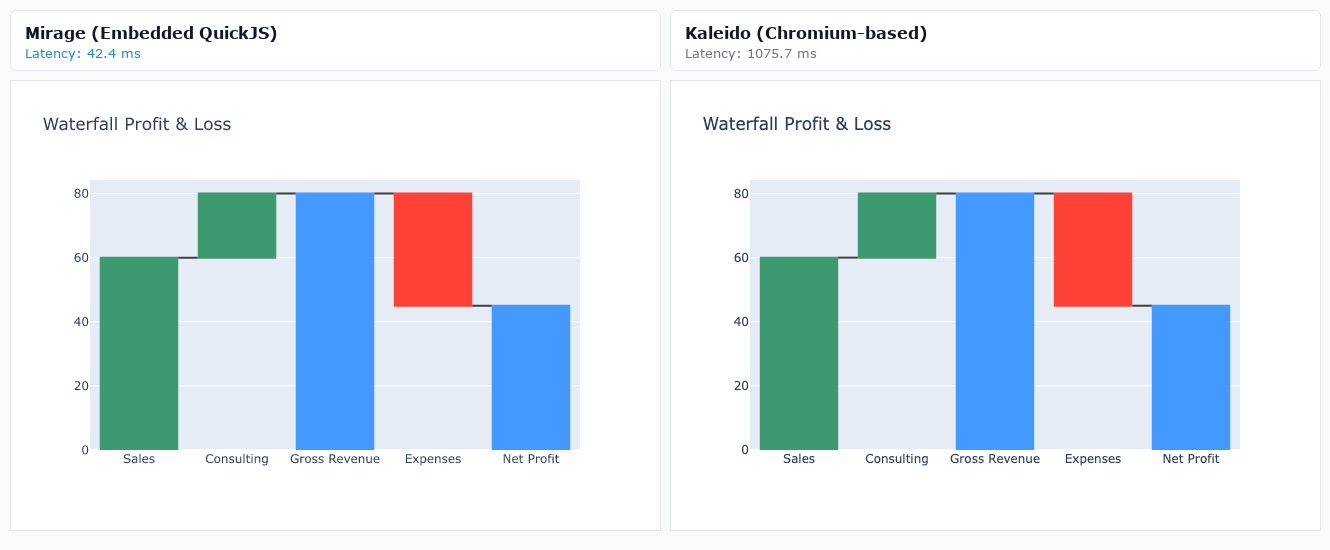
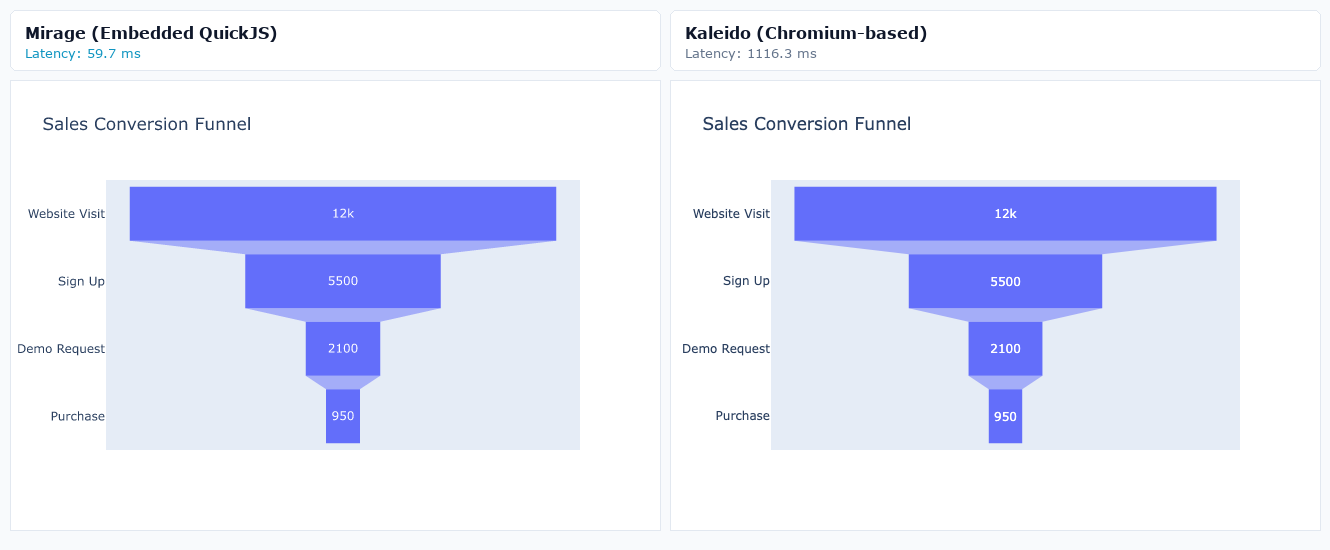
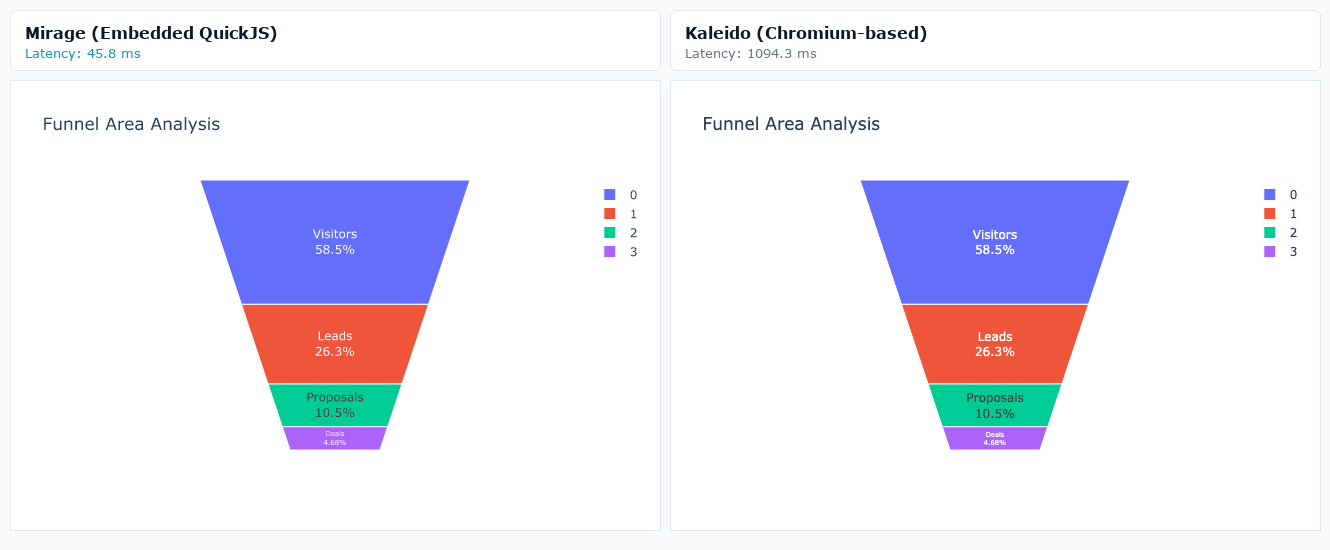
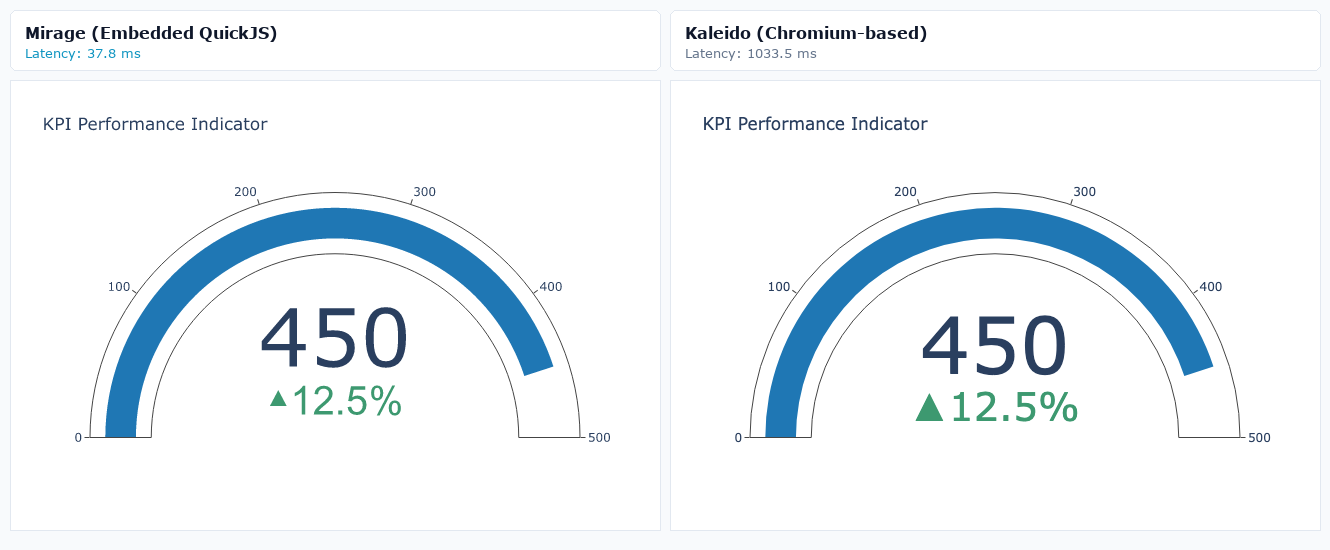
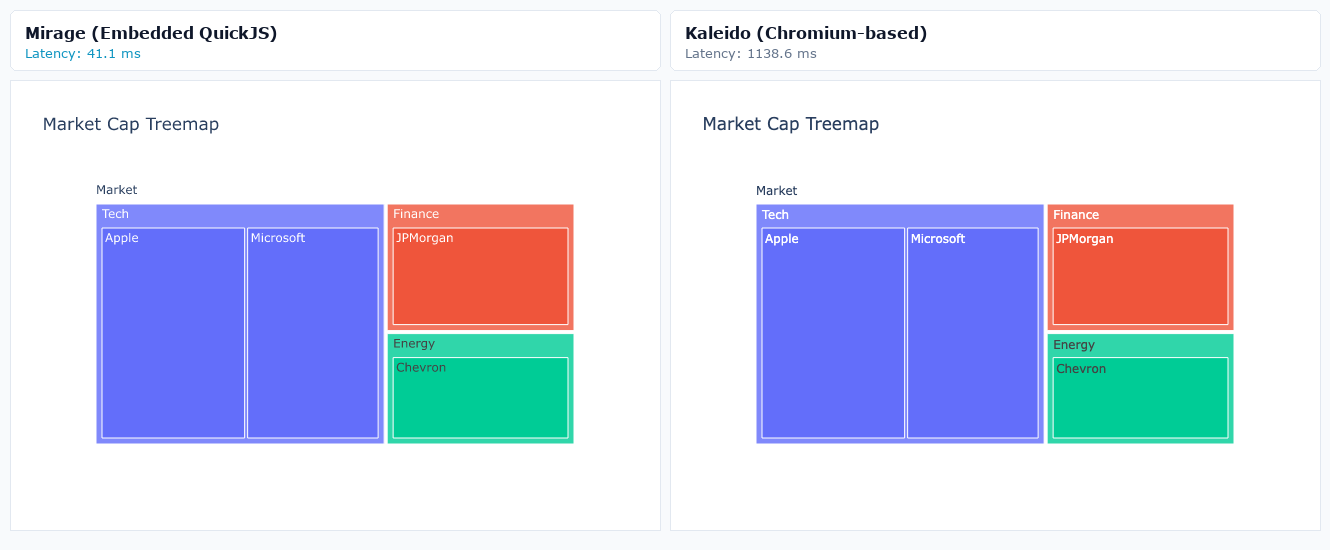
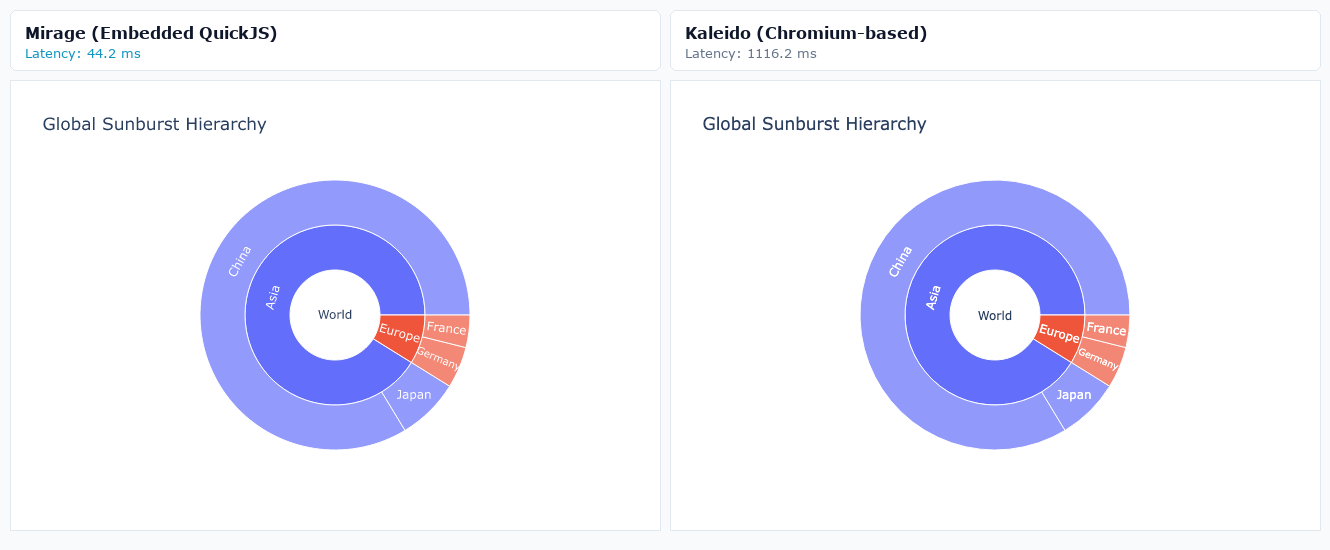
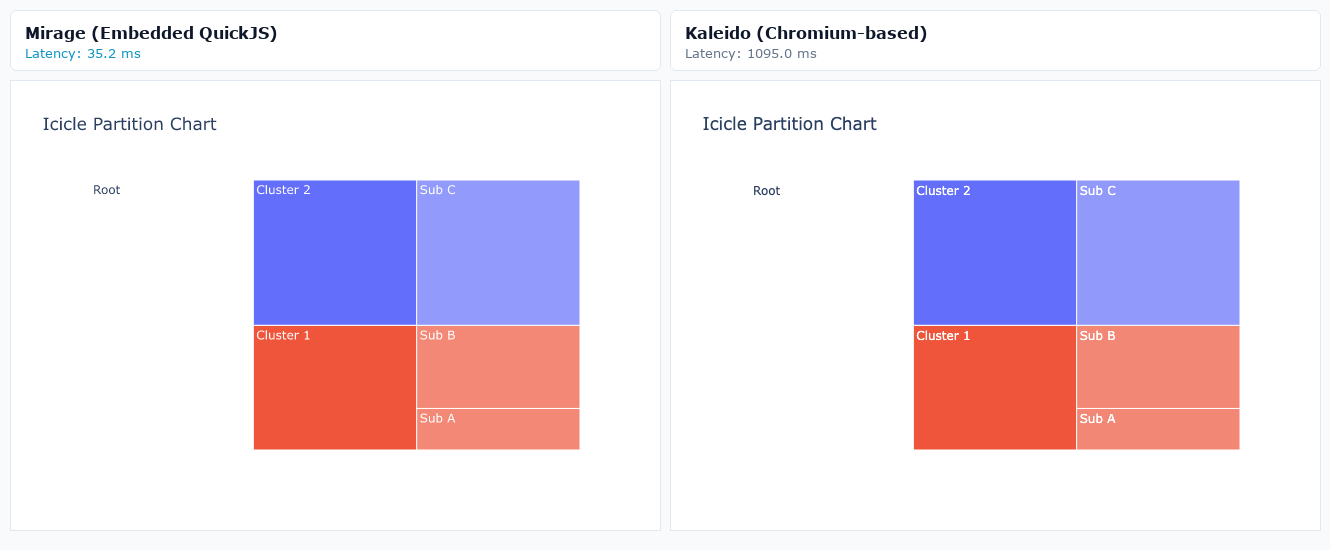
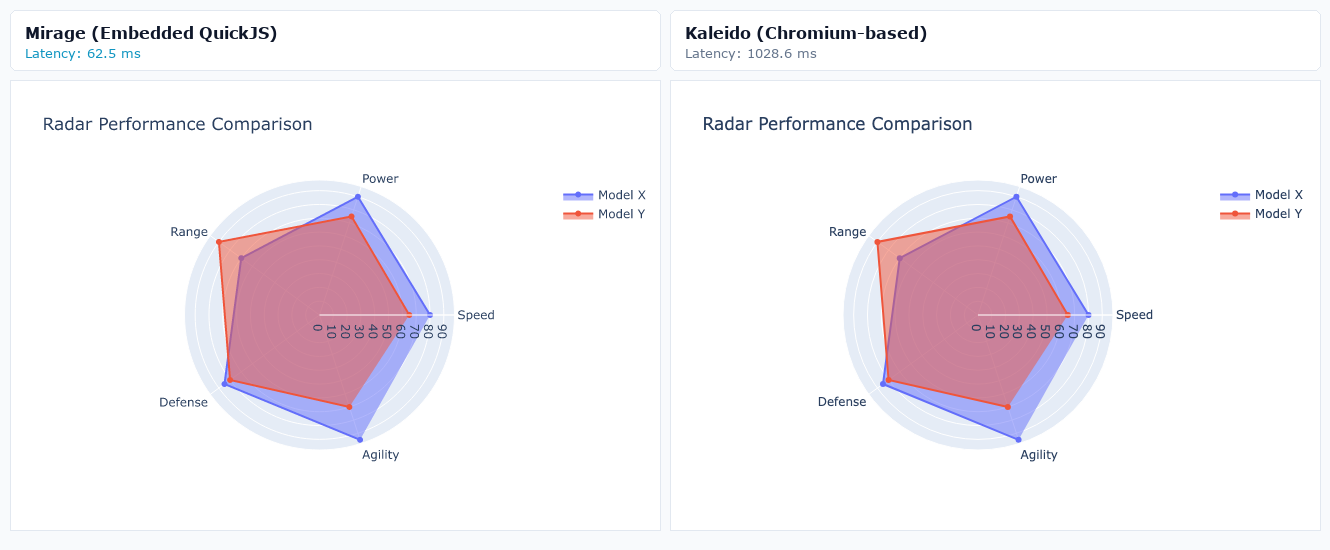
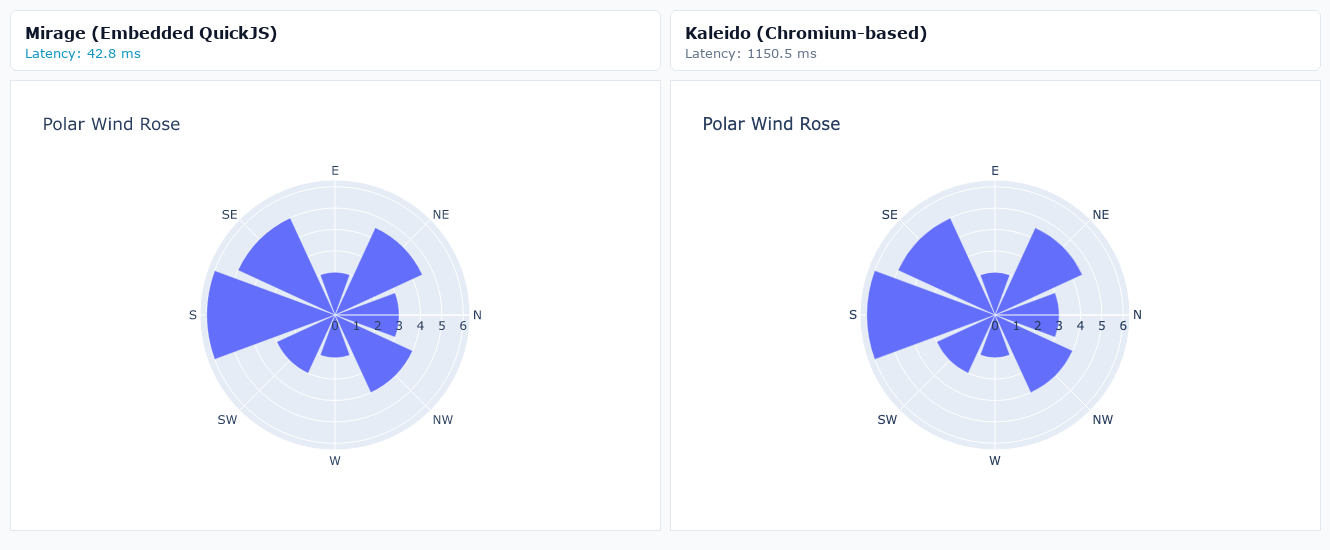
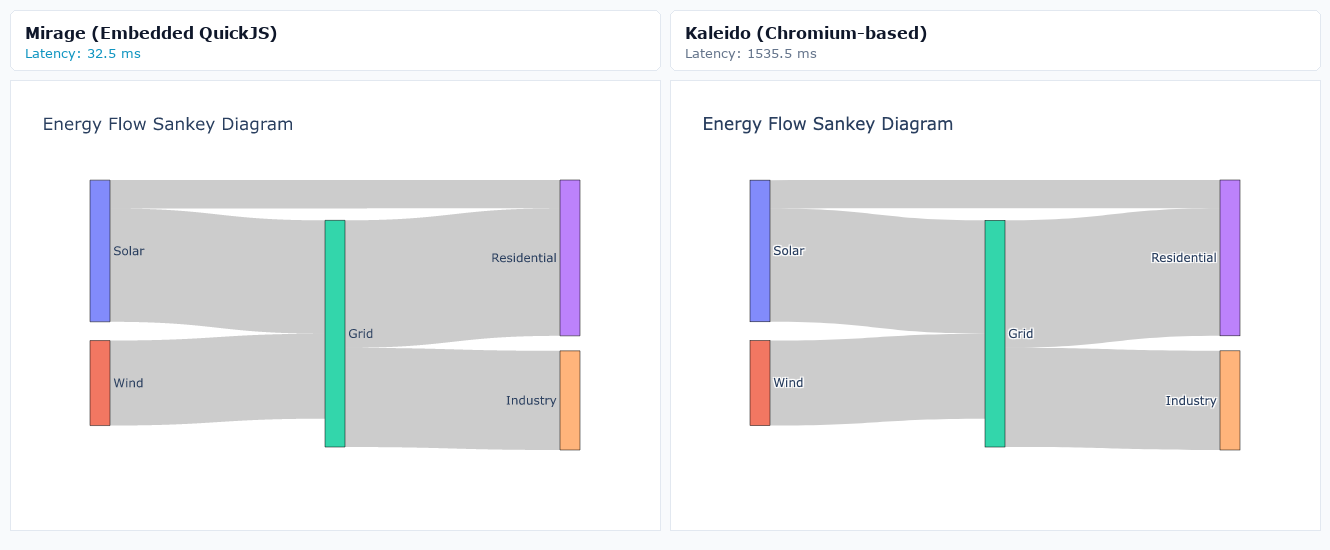
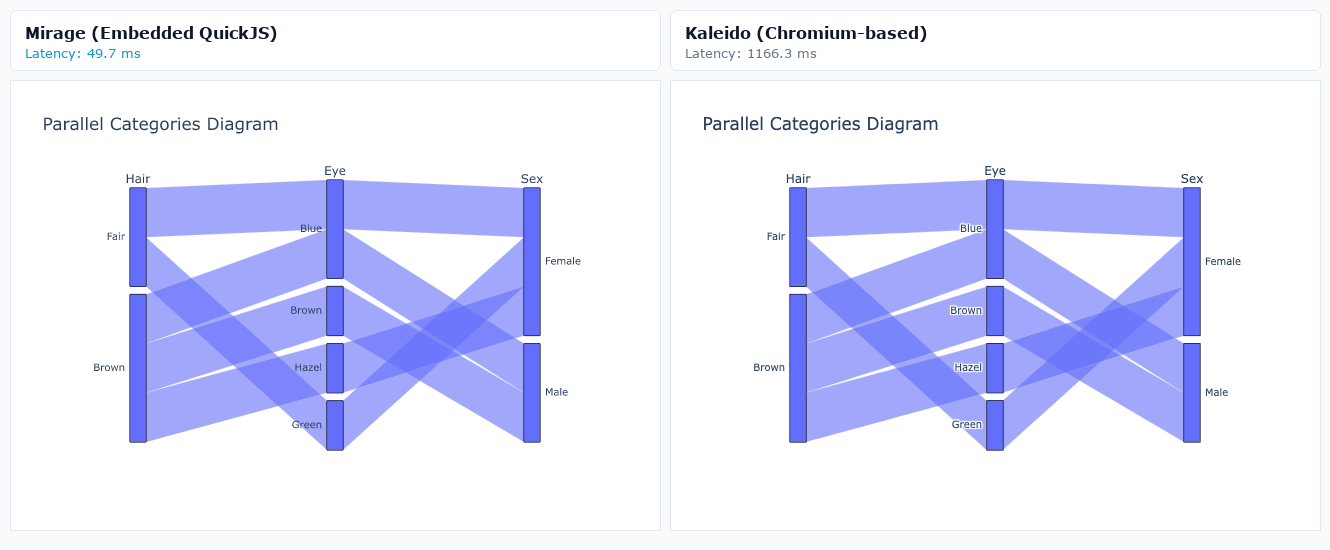
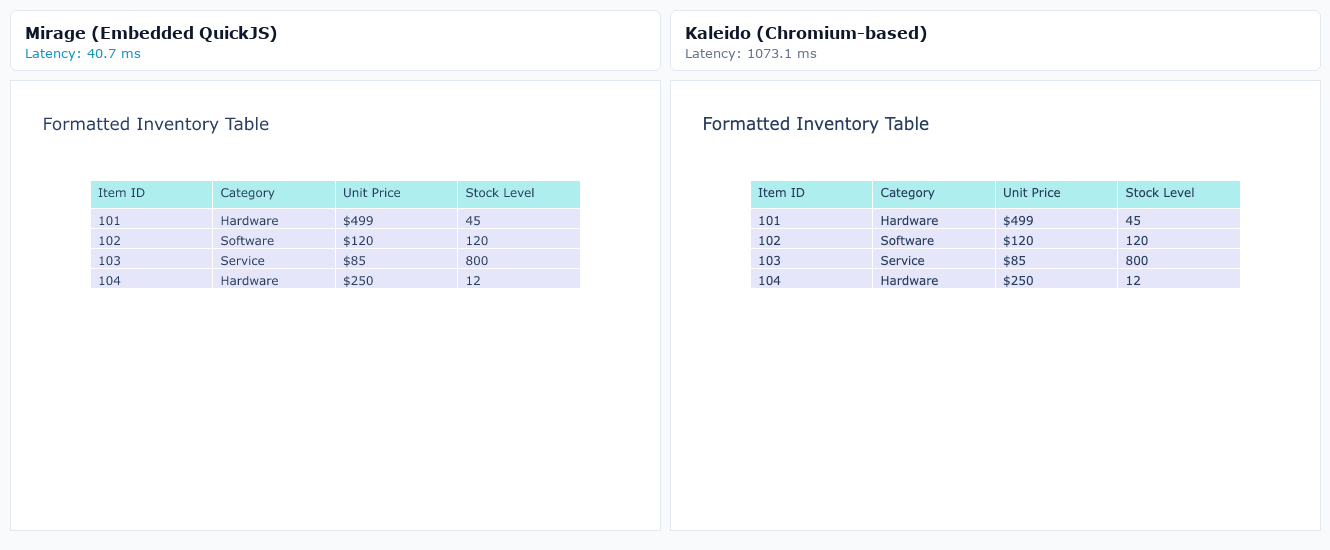
Mirage includes full pure-vector support for all 28 non-WebGL Plotly trace types:
| Category | Supported Traces |
|---|---|
| Core Cartesian | scatter (lines, markers, area, text, ecdf), bar (vertical, horizontal, stacked, grouped, timeline), pie (donut), box, violin, histogram, histogram2d, histogram2dcontour, contour, heatmap, scatterternary, image |
| Financial & Business | candlestick, ohlc, waterfall, funnel, funnelarea, indicator (gauges, KPI big numbers) |
| Hierarchical Partitions | treemap, sunburst, icicle |
| Radial / Polar | scatterpolar (radar/spider), barpolar |
| Specialized Diagrams & Tables | sankey, parcats (parallel categories), table, carpet, scattercarpet, contourcarpet |
(Note: WebGL traces like scatter3d, surface, mesh3d, and parcoords render via GPU shader canvases and are not pure vector SVG).
MIT License. Copyright (c) 2026 Benjamin Lear.