


Prometheus exporter for NVMe SMART log and OCP SMART log metrics, inspired by fritchie nvme exporter and following Prometheus node_exporter design patterns.
- Resilient Operation: Continues running even if nvme-cli is not installed, user is not root, or version is unsupported (similar to Prometheus node_exporter behavior)
- Graceful Degradation: Logs errors and increments failure metrics instead of crashing
- Flexible Collector Management: Enable/disable collectors individually using
--collector.*and--no-collector.*flags - OCP Metrics by Default: OCP SMART log metrics are enabled by default and gracefully disabled if not supported by the drive
- Prometheus-Compatible: Follows Prometheus naming conventions and best practices
Specification versions of reference:
-
NVMe SMART log field descriptions can be found on page 209 of NVMe Base Specification Revision 2.1
-
NVMe OCP SMART log field descriptions can be found on page 24 of Datacenter NVMe SSD Specification v2.5
Supports NVMe CLI versions 2.3 and above.
Note: The exporter will continue to run with unsupported versions, but may produce incorrect data or fail scrapes.
- Docker: Sample
Dockerfilefor containerized deployment - Kubernetes: Deployment manifests in resources/k8s/
- Grafana: Dashboard templates in resources/grafana/
- Prometheus: Recording and alert rules in resources/prom/
- Systemd: Service unit files in resources/systemd/
- Scripts: Package installation hooks in resources/scripts/
- nvme-cli package installed on the host
- root privileges (recommended for full functionality)
Note: The exporter will start without root or nvme-cli installed, but scrapes will fail and increment the
nvme_exporter_scrape_failures_totalmetric.
# Run with all default collectors enabled
nvme_exporter

# View help and available options
nvme_exporter --help| Flag | Description | Default |
|---|---|---|
--web.listen-address |
Address on which to expose metrics and web interface | :9998 |
--web.telemetry-path |
Path under which to expose metrics | /metrics |
| Flag | Description | Default |
|---|---|---|
--collector.<name> |
Enable the specified collector | See table below |
--no-collector.<name> |
Disable the specified collector | - |
--collector.disable-defaults |
Disable all default collectors | false |
| Collector | Description | Enabled by Default |
|---|---|---|
info |
NVMe device info metrics | ✅ Yes |
smart |
NVMe SMART log metrics | ✅ Yes |
ocp |
NVMe OCP (Open Compute Project) SMART log metrics | ✅ Yes |
# Start with all default collectors on default port
nvme_exporter

# Listen on a specific address and port
nvme_exporter --web.listen-address=":9998"

# Change metrics endpoint path
nvme_exporter --web.telemetry-path="/nvme-metrics"

# Disable OCP metrics collection
nvme_exporter --no-collector.ocp

# Only collect SMART metrics (disable info and OCP)
nvme_exporter --collector.disable-defaults --collector.smart

# Enable only info and smart collectors
nvme_exporter --no-collector.ocpBy installing the packaged version (RPM or DEB), the systemd unit will be automatically deployed and started as nvme_exporter.service.
If you are installing from tar.gz, the systemd unit file is provided in this repository.
To customize flags, edit the systemd unit file:
sudo systemctl edit nvme_exporter.serviceAdd your custom flags:
[Service]
ExecStart=
ExecStart=/usr/bin/nvme_exporter --web.listen-address=":9998" --no-collector.ocp# Run with all default collectors
podman run --rm -d --network=host --privileged nvme_exporter
# Run with custom flags
podman run --rm -d --network=host --privileged nvme_exporter \
--web.listen-address=":9998" \
--no-collector.ocp# Run with all default collectors
docker run --rm -d --network=host --privileged nvme_exporter
# Run with custom flags
docker run --rm -d --network=host --privileged nvme_exporter \
--web.listen-address=":9998" \
--no-collector.ocp| Metric Name | Type | Description |
|---|---|---|
nvme_exporter_scrape_failures_total |
Counter | Total number of scrape failures due to fatal validation errors (not root or nvme-cli not found) |
This collector exports metrics from the following nvme-cli commands:
nvme list -o json
nvme smart-log <device> -o json
nvme ocp smart-add-log <device> -o json  # If OCP collector is enabled
All metrics include the device label with the device path (e.g., /dev/nvme0n1).
| Metric Name | Description | Labels |
|---|---|---|
nvme_namespace |
NVMe namespace identifier | device, generic_path, firmware, model_number, serial_number |
nvme_used_bytes |
Used storage capacity in bytes | device, generic_path, firmware, model_number, serial_number |
nvme_maximum_lba |
Maximum Logical Block Address | device, generic_path, firmware, model_number, serial_number |
nvme_physical_size |
Physical size in bytes | device, generic_path, firmware, model_number, serial_number |
nvme_sector_size |
Sector size in bytes | device, generic_path, firmware, model_number, serial_number |
Gauge Metrics
| Metric Name | Description |
|---|---|
nvme_critical_warning |
Critical warnings for the controller state. Bits indicate spare capacity, temperature, degraded reliability, or read-only mode |
nvme_temperature |
Current composite temperature in Kelvin |
nvme_avail_spare |
Available spare capacity as a normalized percentage (0-100) |
nvme_spare_thresh |
Available spare capacity threshold below which an asynchronous event is generated |
nvme_percent_used |
Vendor-specific estimate of the percentage of device life used (0-255) |
nvme_endurance_grp_critical_warning_summary |
Critical warnings for endurance groups. Contains the OR of all critical warnings for all endurance groups |
Counter Metrics
| Metric Name | Description |
|---|---|
nvme_data_units_read |
Total number of 512-byte data units read from the NVMe device by the host |
nvme_data_units_written |
Total number of 512-byte data units written to the NVMe device by the host |
nvme_host_read_commands |
Total number of read commands completed by the controller |
nvme_host_write_commands |
Total number of write commands completed by the controller |
nvme_controller_busy_time |
Total time in minutes the controller was busy processing I/O commands |
nvme_power_cycles |
Total number of power cycles |
nvme_power_on_hours |
Total number of power-on hours. May not include time when the controller was powered but in a low power state |
nvme_unsafe_shutdowns |
Total number of unsafe shutdowns where the controller was not properly notified before power loss |
nvme_media_errors |
Total number of unrecovered data integrity errors detected by the controller |
nvme_num_err_log_entries |
Lifetime number of error log entries available in the Error Information Log |
nvme_warning_temp_time |
Total time in minutes the controller temperature exceeded the warning threshold |
nvme_critical_comp_time |
Total time in minutes the controller temperature exceeded the critical composite temperature threshold |
nvme_thm_temp1_trans_count |
Total number of times the controller transitioned to a lower power state due to thermal management (threshold 1) |
nvme_thm_temp2_trans_count |
Total number of times the controller transitioned to a lower power state due to thermal management (threshold 2) |
nvme_thm_temp1_trans_time |
Total time in seconds the controller was in a lower power state due to thermal management (threshold 1) |
nvme_thm_temp2_trans_time |
Total time in seconds the controller was in a lower power state due to thermal management (threshold 2) |
Note: These metrics are only available if the NVMe drive supports OCP vendor-specific commands. If not supported, the collector will log a warning and continue with other metrics.
Counter Metrics
| Metric Name | Description |
|---|---|
nvme_physical_media_units_written_hi |
Physical media units written to the device (high 64 bits). Unit size is 1000h sector size |
nvme_physical_media_units_written_lo |
Physical media units written to the device (low 64 bits). Unit size is 1000h sector size |
nvme_physical_media_units_read_hi |
Physical media units read from the device (high 64 bits). Unit size is 1000h sector size |
nvme_physical_media_units_read_lo |
Physical media units read from the device (low 64 bits). Unit size is 1000h sector size |
nvme_bad_user_nand_blocks_raw |
Raw count of user NAND blocks that have been retired due to errors |
nvme_bad_user_nand_blocks_normalized |
Normalized value (0-100) of bad user NAND blocks relative to the maximum allowed |
nvme_bad_system_nand_blocks_raw |
Raw count of system area NAND blocks that have been retired due to errors |
nvme_bad_system_nand_blocks_normalized |
Normalized value (0-100) of bad system NAND blocks relative to the maximum allowed |
nvme_xor_recovery_count |
Total number of times data was recovered using XOR parity |
nvme_uncorrectable_read_error_count |
Total number of uncorrectable read errors that could not be recovered |
nvme_soft_ecc_error_count |
Total number of soft ECC errors that were corrected |
nvme_end_to_end_detected_errors |
Total number of end-to-end data protection errors detected |
nvme_end_to_end_corrected_errors |
Total number of end-to-end data protection errors that were corrected |
nvme_refresh_counts |
Total number of NAND page refresh operations performed |
nvme_max_user_data_erase_counts |
Maximum number of erase cycles performed on any user data block |
nvme_min_user_data_erase_counts |
Minimum number of erase cycles performed on any user data block |
nvme_number_of_thermal_throttling_events |
Total number of times thermal throttling was activated |
nvme_pcie_correctable_error_count |
Total number of PCIe correctable errors detected |
nvme_incomplete_shutdowns |
Total number of incomplete or unsafe shutdown events |
nvme_unaligned_io |
Total number of unaligned I/O operations performed |
nvme_plp_start_count |
Total number of times the Power Loss Protection (PLP) mechanism was activated |
nvme_pcie_link_retraining_count |
Total number of PCIe link retraining events |
nvme_power_state_change_count |
Total number of power state transitions |
Gauge Metrics
| Metric Name | Description |
|---|---|
nvme_system_data_percent_used |
Percentage of system data area used (0-100) |
nvme_current_throttling_status |
Current thermal throttling status (0=not throttled, 1=throttled) |
nvme_percent_free_blocks |
Percentage of free NAND blocks available (0-100) |
nvme_capacitor_health |
Health indicator of the power loss protection capacitor (vendor-specific scale) |
nvme_security_version_number |
Security version number of the device firmware |
nvme_nuse_namespace_utilization |
Namespace utilization as reported by the device |
nvme_endurance_estimate |
Estimated remaining endurance of the device as a percentage (0-100) |
nvme_log_page_version |
Version number of the OCP SMART log page specification |
nvme_log_page_guid |
GUID (Globally Unique Identifier) of the OCP SMART log page |
nvme_errata_version_field |
Errata version field from the OCP specification version |
nvme_point_version_field |
Point version field from the OCP specification version |
nvme_minor_version_field |
Minor version field from the OCP specification version |
nvme_major_version_field |
Major version field from the OCP specification version |
nvme_nvme_errata_version |
NVMe base specification errata version supported by the device |
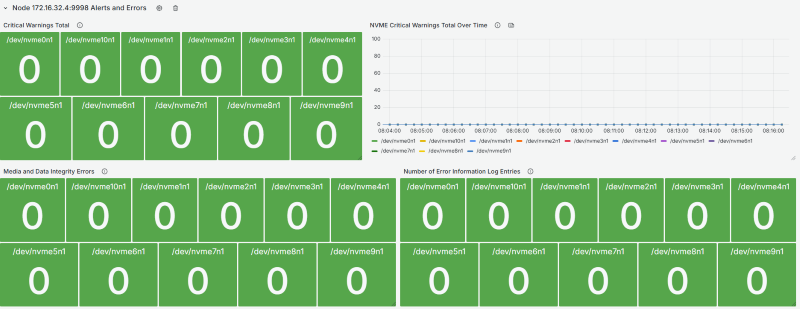
Grafana dashboards are available in the resources/grafana/ directory.
OCP Metrics
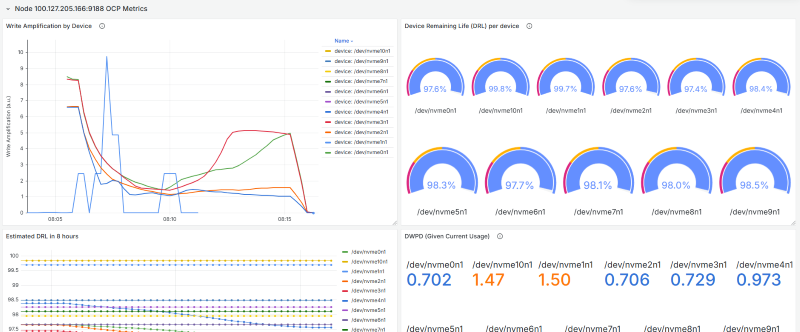
Endurance Metrics
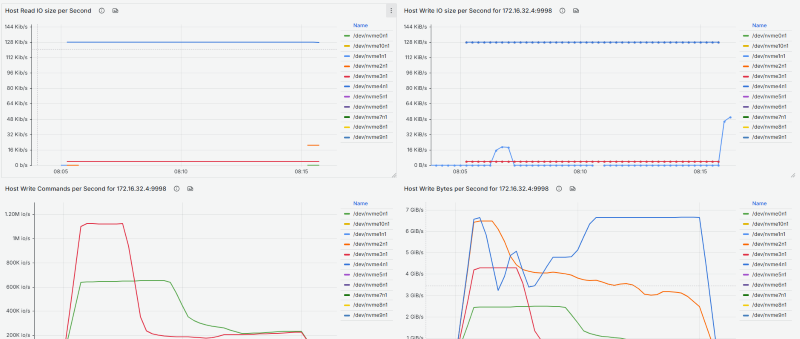
Statistics Metrics
Error Metrics
Add this to your prometheus.yml:
scrape_configs:
  - job_name: 'nvme'
    static_configs:
- targets: ['localhost:9998']Example recording and alert rules are available in resources/prom/.
Symptom: The exporter starts successfully, but scrapes return no NVMe metrics, only the nvme_exporter_scrape_failures_total metric is incrementing.
Possible causes:
- Not running as root
- nvme-cli not installed
- Unsupported nvme-cli version
Solution: Check the exporter logs for WARNING messages indicating the specific issue.
Symptom: OCP metrics are not being exported.
Possible causes:
- NVMe drive doesn't support OCP vendor-specific commands
- OCP collector disabled with
--no-collector.ocp
Solution: Check exporter logs for "OCP metrics not supported" messages. This is normal for non-OCP drives.
Symptom: Logs show permission denied when accessing /dev/nvme* devices.
Solution: Run the exporter as root or with appropriate capabilities:
sudo nvme_exporterOr with Docker/Podman:
podman run --privileged nvme_exporterSee LICENSE file for details.
Contributions are welcome! Please open an issue or submit a pull request.
- Inspired by fritchie/nvme_exporter
- Follows design patterns from prometheus/node_exporter