feat(om): two-window orientation result — map window + IPF explorer - #108
Conversation


dcf7432 to
4ed6351
Compare

|
Updated for anyplotlib 0.7.0 (floor bumped from
1.
|
| before (point patch) | after (texture) |
|---|---|
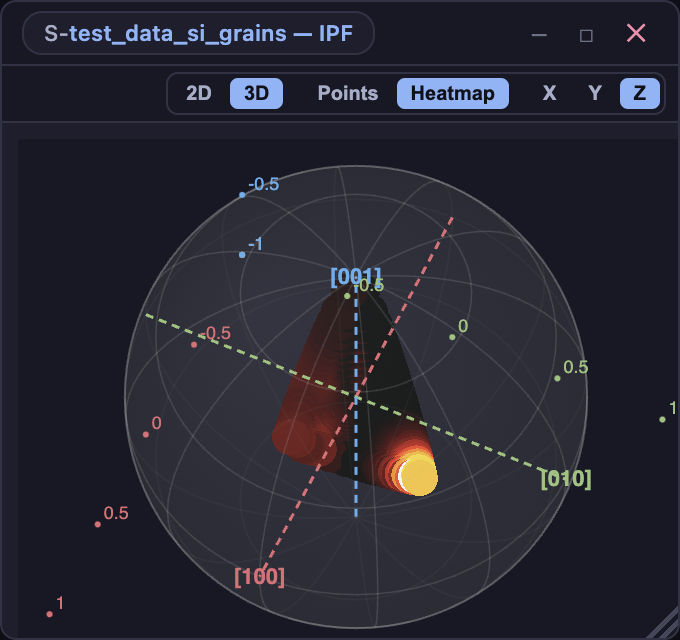 |
see electron/ipf_two_window_shots/07-3d-heatmap.png |
2. 240df23 — the colour key is a hover overlay, not a second figure
add_key is built for exactly this case, so the key stops being an entire
second anyplotlib figure — its own emit, iframe, resize call and state
replay — and becomes one call on the map plot. hover_only=True keeps the map
unobstructed; it is still baked into PNG export.
A key belongs to the figure it annotates, which removes a structural oddity:
each projection chip is its own figure, so the old key had to float over the
whole window and be conditionally hidden whenever a non-map view was showing.
Now IPF-X/Y/Z each carry their own key and the 3-D explorer simply has none —
no renderer logic at all. Deleted: build_ipf_key_figure, emit_ipf_key,
the pinned iframe, the ipfKey style, the ipf_key filters in
WindowContent/MDIArea, and ipf_key.spec.ts (it injected a figure the
backend no longer emits and asserted a testid that no longer exists).
Labels are aligned away from their edge — two of the cubic sector's three
corners sit hard against the key's boundary, and centre-aligning them clipped
[1 1 1] and [1 0 1] against the panel edge. That was visible in the first
screenshot and is fixed.
Verification
Both changes are rendering changes, so they were checked by looking at pixels,
not just by a green suite:
- cold vs hover:
electron/ipf_two_window_shots/11-key-cold.png,12-key-hover.png - the new e2e asserts the cold→hover pixel diff (~45k px changed), so a
silently-deadhover_onlycannot pass - 2435 Python tests, 6 e2e,
tscclean on both configs
Still not verified
The EBSD coverage gap in the description is unchanged — kikuchipy is now
installed here, so that path is unblocked if you want it covered before merge.
85a8473 to
2f01ccd
Compare

…an IPF explorer

The orientation result put everything in one window. It is now two, matching how
the two things are actually read:

* Window 1 — the orientation MAP, with IPF-X / IPF-Y / IPF-Z chips to switch
  projection (the existing chip-strip idiom, so ⌘-tile still works).
* Window 2 — the IPF EXPLORER (new `spyde/actions/ipf_window.py`), with two
  independent toggle pairs, [2D | 3D] and [Points | Heatmap], plus an X/Y/Z
  direction selector. Picking on the map marks that orientation in the figure,
  and in 3D it ROTATES THE SPHERE to bring it to the centre.

Heatmap is orix's inverse pole density function; Points is the per-pixel scatter.
Both render through anyplotlib as it stands today — the unmerged anyplotlib #48
(plotting to a surface) turned out not to be needed for the 3D density view.

Shared by the raw and vector orientation paths rather than duplicated: both go
through the same window builder, so `orientation_action.py` and
`vector_orientation_om.py` each changed by a couple of lines.

Also fixes a hook-timeout bug in the new vector-OM spec: a file-scope
`test.setTimeout` applies to TESTS, not HOOKS, so `beforeAll` silently kept the
120 s config default while booting Electron, a real LocalCluster, find-vectors
and the OM fit — it timed out before the first test ran. Raised from inside the
hook, where Playwright honours it.
anyplotlib >= 0.6.0 ships Plot3D.set_texture, which is what this builder was
waiting for — its own docstring said so ("when that lands, this builder can
wrap the 2-D density raster straight onto the sector surface and the point
patch goes away").

Older plot_surface colour-mapped by the Z COORDINATE, so a sphere patch could
only be coloured by height and the density had to be approximated with a dense
cloud of 9px discs. At any real zoom that read as a dot grid, and overlapping
discs painted over each other — which is why the old render showed the hot spot
as a blob well away from [001] while the 2-D heatmap put it at the origin. The
textured surface peaks 22.7 deg off [001], matching the 2-D reference.

_density_sphere_points becomes _density_sphere_grid: the density grid keeps its
(H, W) shape instead of being flattened, so it IS a mesh, and the raster lines
up with it index for index under the default parametric mapping (no uv needed).

The fundamental sector is not rectangular and the grid is, so the mask travels
in the texture's ALPHA channel rather than in the geometry — anyplotlib's
textured-surface pipeline blends per-texel alpha. Geometry stays complete
because a NaN vertex tears the mesh: cells with no inverse projection get a
finite placeholder and are masked like the rest.

5 e2e pass (incl. the 3-D heatmap screenshot); 2432 Python tests pass.
anyplotlib 0.7.0's Plot2D.add_key (PR #49) is built for exactly this case — an
IPF triangle pinned over an orientation map — so the key stops being an entire
second anyplotlib FIGURE with its own emit, its own iframe, its own resize call
and its own state replay, and becomes one call on the map plot itself.

hover_only keeps the map unobstructed: nothing is drawn until the pointer is
over the panel, and the key is still baked into a PNG export either way.

A key belongs to the FIGURE it annotates, which fixes a structural oddity as a
side effect. Each projection chip is its own figure, so the old separate key
had to be floated over the whole window and conditionally hidden whenever a
non-map view was showing (IPF_VIEWS check in the renderer). Now IPF-X/Y/Z each
carry their own key and the 3-D explorer simply has none — no renderer logic
required. emit_view_figure grows a `key=` argument to pass it down.

Labels are ALIGNED AWAY FROM THEIR EDGE. Two of the cubic sector's three
corners sit hard against the key's boundary, and centre-aligning them (the
obvious first cut, and what the first screenshot showed) clipped "[1 1 1]" and
"[1 0 1]" against the panel edge.

Deletes build_ipf_key_figure, emit_ipf_key, the renderer's pinned iframe and
its `ipfKey` style, the ipf_key filters in WindowContent/MDIArea, and
ipf_key.spec.ts — that spec injected a `view="ipf_key"` figure the backend no
longer emits and asserted a testid that no longer exists.

Verified by looking at the pixels: cold shows no key, hover reveals it with all
three indices legible (electron/ipf_two_window_shots/11-key-cold.png,
12-key-hover.png). New e2e asserts the hover diff (~45k px changed) so a
silently-dead hover_only cannot pass.

2435 Python tests pass, 6 e2e pass, tsc clean.
The key is drawn bare, directly on the orientation map, and its corner indices
are white. An IPF map is saturated colour edge to edge — including pale yellows
and lavenders — so on those regions the labels were white-on-near-white and
effectively invisible. Which orientation happens to sit under the key is a
property of the data, so there is no map for which "bare" is reliably legible.

`add_key` already takes the card (anyplotlib #49: "Optional bgcolor / border /
alpha give it a card when the data underneath is busy"), so this is just asking
for it: a translucent dark slab at the app's surface colour plus a hairline
border, applied at BOTH call sites — the live map plot (`attach_ipf_key`) and
the per-chip view figures (`emit_view_figure`), which would otherwise disagree
depending on which projection chip was showing.

Kept as module constants rather than inline literals because the two call sites
must match, and a key that changes appearance when you click a chip reads as a
bug.

Verified by looking at it: 12-key-hover.png now shows [1 1 1] / [0 0 1] /
[1 0 1] white-on-dark over a pale yellow-green map that previously swallowed
them. The e2e hover diff grows 46,372 -> 53,699 px as the card adds coverage.
40 unit tests and 6 e2e pass.
`test_sidecar_round_trip_skips_the_compute_entirely` failed on macos-py3.13
with "no sidecar written" while every other job — and a full local run on the
same platform and Python — passed.

Same shape as the other races this suite has: it waits for ONE signal and
asserts a DIFFERENT, later fact.

    assert _wait(lambda: isinstance(... navigator_signals["base"][1].data, ...))
    assert os.path.exists(sidecar_path(str(src)))      # no wait

The navigator array becoming an ndarray means the compute produced it; the
sidecar is written afterwards by that same background work. Checking the file
the instant the array appears is a race, and a loaded runner loses it. Now it
waits for the sidecar itself, which is what the test actually claims.

Unrelated to this PR's subject (nothing here touches nav sidecars) — it is
pre-existing on main and simply blocks this branch, since the Python matrix is
the one lane without continue-on-error. Happy to move it to its own PR against
main if you would rather keep this branch to the IPF work.
… old one

Splitting the explorer's controls into two independent pairs — [2D|3D] and
[Points|Heatmap] — retired the `ipf-view-density` testid: density is now the
Heatmap half of the SECOND pair, orthogonal to the projection rather than a
third value of it. Two specs outside the new ones still clicked the old id and
failed on a locator that can no longer exist (`ipf_perf` timed out on it,
`orientation_lazy` never found it).

`ipf_perf` also has to put the style BACK to Points before step 4: the pairs are
independent now, so the density it selects in step 2 would otherwise carry into
the 3-D step and the point scatter that step exists to prove would never draw.

Also bump the anyplotlib floor to 0.7.1. From 0.5.0 on, `_sync_for_export`
re-pushes every panel from inside an export, and under the Electron binary
transport that push wrote dangling "\x00bin:" tokens into `panel_<id>_json` —
so a report cell's `add_layer` overlay shipped with no bytes behind it and drew
nothing. That is `report_overlay_tint` and `report_compose` on this branch,
which were red only because this branch is the one that raised the floor past
0.4.2. Fixed upstream in 0.7.1.
…sing

The hover-key check aimed at 0.72/0.75 of the WINDOW. `mouseenter` comes off
anyplotlib's OVERLAY canvas, which is sized to the IMAGE rect alone, not the
panel — so a corner-ward point is only inside it for the aspect ratio it was
eyeballed at, and the key is pinned bottom-right no matter where the pointer
is. The centre proves the same thing without the geometry assumption.

`hovering the map did not reveal the IPF colour key` also cannot distinguish
its three causes, which is why this one is still unexplained on Linux CI while
green here on both 0.7.0 and 0.7.1. `keyCanvases()` reads every key overlay
(anyplotlib gives keys their own z-7 canvas) and separates them: no canvas =
add_key never reached the figure; display:none = the figure declares no key;
painted:0 = declared but the hover flag never flipped or the key image is still
decoding. Logged cold and hot, so the next CI run says which.
3eeb130 to
c934978
Compare
The vectors explorer's sibling. A find-vectors result earns its embed by being
a compact CSR buffer; an orientation result is smaller still — per nav position
one best-match orientation, which packs to a sector (x, y), a unit-sphere
direction and an IPF colour. 20 bytes per position per sample direction, so a
13k-position scan is ~0.8 MB against the vectors explorer's ~21 MB.

ONE anyplotlib figure, three panels, mirroring the app's two windows: the IPF
MAP with a crosshair, the fundamental-sector TRIANGLE with a marker on the
picked orientation, and the unit SPHERE with a highlight — which the camera
turns to face, the same `face_camera` aim `IpfWindowController.show_orientation`
uses. X/Y/Z re-colours all three. A pick is an array index, so the page needs no
orix, no backend and no network.

Three panels rather than the app's 2D⇄3D toggle: a toggle would have to swap
panel KINDS inside one mounted figure, and the report needs a single figure /
single mount() — that is what renders in the SIDEBAR instead of degrading to a
plain snapshot.

`orientation_mode` mirrors `vectors_mode` for pinning a cell to its static
snapshot, but gets no drop-time prompt: the prompt exists because a vectors blob
can reach tens of MB and this one cannot.

Verified in a real browser over file:// with no app behind it
(orientation_report_embed.spec.ts, screenshots in orientation_embed_shots/):
all three panels paint, the two nav halves give visibly different orientations,
the sphere's pixels really change, X/Y/Z re-colours, and a REAL crosshair drag
lands the pick on the position it was released over. The camera aim is pinned by
a PIXEL assertion — the white highlight must sit within the middle 40% of the
sphere panel, because `atan2(vy, vx) - 90°` aims the same direction 180° out and
parks it on the far edge, which every state-changed assertion passes happily.
That was the first cut, and the screenshot is what caught it.
Writing `vertices` and `colors` into `panel_<id>_json` changed nothing:
anyplotlib hoists a 3-D panel's vertices and per-point colours into a separate
`panel_<id>_geom` trait (_applyGeom / _loadGeom) precisely so a camera nudge
never re-transmits the cloud. The view json has only `vertices_count` and
`geom_type`. So the map and the triangle re-coloured and the sphere kept the Z
colours — and the whole-figure pixel diff in test 4 passed on the other two
panels alone, which is exactly why it went unnoticed.

The switch now rewrites the geom channel with the wire dtypes the Python side
encodes (vertices float32 N*3, point colours uint8 N*3, z float32 N) and bumps
`_geom_rev`; the trait's own change observer reloads and redraws.

Test 4b crops the sphere third and diffs IPF-Z against IPF-Y, so a whole-figure
diff can never stand in for it again. Also `getattr` for `orientation_mode` in
the export path — a spec there is whatever the caller built, and the vectors
tests' stubs predate the field.
`FitWizard.current_indices` read the selector's `current_indices` attribute.
That attribute is written by `_run_update` on the `_NavDispatcher` THREAD, while
this runs on the asyncio main thread — and the renderer sends `fit_navigated`
off the same pointer event that started the navigator update. So the handler can
arrive before the dispatcher has committed the new position, recall the PREVIOUS
pixel's fit, and never be corrected: nothing re-fires, so the caret sits on a
stale model until the user moves again.

`get_selected_indices()` is the same pure geometry call `_run_update` itself
makes — the attribute is just its last result — so this is the same number, only
never behind. Which selector wins is unchanged (still the first with a committed
position), so the fit-the-navigation-mean bug the docstring records cannot come
back; only the VALUE is made current.

Honest about what this is: `fit_navigate.spec.ts` fails roughly 1 run in 10
locally and failed BOTH CI attempts on this branch, always on a SLOW run — and
9 traced runs never caught it in the act, so this is the race the code plainly
has and that matches the failure signature, not a reproduction I then fixed. 119
fit-wizard tests and 3 fit_navigate runs are green after it.

Also correct the orientation embed's docstring to the measured numbers: at
sped_ag scale (13,312 positions) packing is 0.38 s for a 1.24 MB blob and the
page is 3.04 MB, not the ~0.8 MB the first estimate claimed.
The spec opted into `channel: 'chromium'` + --enable-unsafe-webgpu to give
headless a real navigator.gpu. It paints fine here; on the CI runner it produced
three correctly-sized panels with ZERO pixels in any of them — the plain 2-D map
included, so this was never about the 3-D path. Plain `chromium.launch()`, the
same launch vectors_report_embed has been passing CI with for months. The sphere
then draws through anyplotlib's Canvas2D fallback, which is what a reader
without WebGPU gets anyway, and every assertion here is about pixels rather than
about which path drew them.

Also wait for the PIXELS instead of sleeping 2 s after `data-ready`: that flag
only says the script finished, and a fixed sleep is exactly what turns a loaded
runner into "nothing painted". The poll has teeth — if they never arrive it
still fails, just with the right message.
… toggles

Three panels side by side was a workaround for "a toggle would have to swap
panel KINDS inside one mounted figure". It would — but the page can simply mount
more than one figure. So the embed is now the app's two windows: the MAP with
its crosshair on its own mount, and ONE explorer view chosen by the same two
independent pairs the IPF window has. Each view is a separate figure MOUNTED
LAZILY on first selection — a figure mounted into a display:none box measures
0x0 and draws nothing, and three of the four may never be opened.

Adds the two heatmap views, which are orix's `pole_density_function` — an
equal-area binning in the fundamental sector. That cannot be recomputed in the
page (a histogram of the stereographic coordinates is a different, uncorrected
quantity), so it is computed at build time. Their GEOMETRY is
direction-independent — measured identical across x/y/z, since the grid is a
property of the point group — so only the raster and the texture travel per
direction, as PNG data URLs rather than raw bytes: 262 kB of RGBA becomes ~7 kB,
and `set_texture` wants a data URL anyway.

FIXES THE COLOURS. On an X/Y/Z switch the scatter moved its points but kept the
previous direction's colours, so a strongly textured sample read as a flat green
triangle. `facecolors` is the PYTHON kwarg; `MarkerGroup.to_wire` renames it to
`fill_color`, and writing the python name was silently ignored. Test 6 now pins
the colours themselves, not just that pixels changed.

Panel lists come from `layout_json`'s `panel_specs` — the axis creation order —
because every per-phase update maps panel i to phase i, and `figure_state`'s key
order is not that. Multi-phase gets one panel per present phase in every view,
mirroring the live builders; only single-phase is verified here.

Also: the sphere-centring test clipped to a guessed 0.62 of the row, which put
the panel centre at 0.35 and passed anyway on a ±0.22 tolerance. It now clips to
the view's own measured box (±0.12), and since the camera centring the highlight
is the POINT, the pick is proven by the REST of the sphere moving instead.
1 participant

Splits the orientation-mapping result into the two things people actually read separately.
Window 1 — the orientation map, with IPF-X / IPF-Y / IPF-Z chips (the existing chip-strip idiom, so ⌘-tile still works).
Window 2 — the IPF explorer (new
spyde/actions/ipf_window.py):[2D | 3D]and[Points | Heatmap]as independent toggle pairs, plus an X/Y/Z direction selector. Picking on the map marks that orientation, and in 3D rotates the sphere to bring it to the centre.Heatmap is orix's inverse pole density function; Points is the per-pixel scatter. Both render through anyplotlib as it stands — the unmerged anyplotlib #48 turned out not to be needed for the 3D density view.
The raw and vector paths share one window builder rather than duplicating it, so
orientation_action.pyandvector_orientation_om.pyeach changed by a couple of lines.Window 2, all four toggle states
Picking rotates the sphere
Before → after a pick on the map. Diffed numerically as well as by eye: 7% of pixels change, and the selected orientation ends up centred under the marker.
Vector OM gets the same pair
Coverage — please read
The ask was all four combinations (raw/vector × 4D-STEM/EBSD). Visually verified here:
kikuchipyis not installed in this environment, so hyperspy registers no EBSD signal class,signal._signal_typeis empty, and thesignal_types: [EBSD]toolbar gate cannot match — the EBSD entry point never appears. The code path is shared with the verified ones, but I have no picture of it and am not claiming it works. Installing thespyde[ebsd]extra unblocks this (it also blocks fix(ebsd): square-pixel gnomonic projection — the Kikuchi overlay is NOT flipped, but is sheared on non-square detectors #106's e2e).Also fixed
A hook-timeout bug in the new vector-OM spec: a file-scope
test.setTimeoutapplies to tests, not hooks, sobeforeAllsilently kept the 120 s config default while booting Electron + a real LocalCluster + find-vectors + the OM fit, and timed out before the first test ran. Raised from inside the hook, where Playwright honours it. The setup itself takes ~32 s.Tests
24 new Python tests (
test_ipf_two_window.py) and 8 e2e across two new specs — all green with real Dask.